 |
(10.3) |
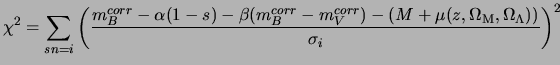
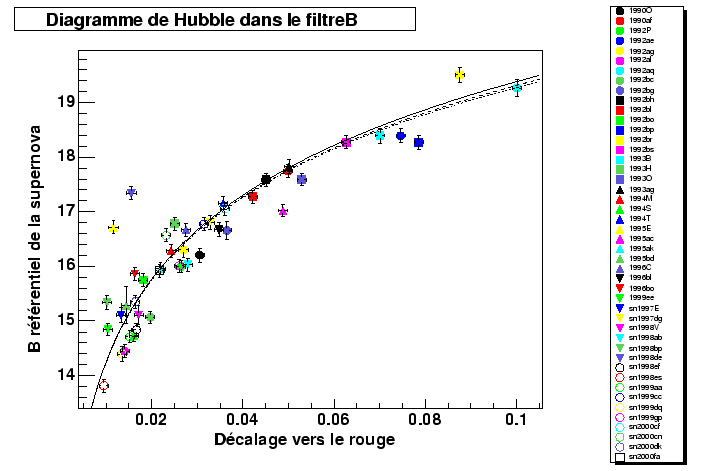
We built a diagram of Hubble in the close filter B of the batch of supernovæ. For that, the following model was adjusted:
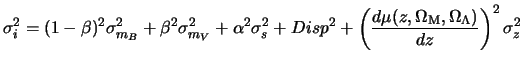
where the error ![]() for a point of measurement is written:
for a point of measurement is written:
where ![]() the error to the measure of the redshift. We consider an
intrinsic error on the redshift of 0.001 corresponds to
the dispersion observed of the own movements of the galaxies.
the error to the measure of the redshift. We consider an
intrinsic error on the redshift of 0.001 corresponds to
the dispersion observed of the own movements of the galaxies.
The adjusted parameters are ![]() respectively the correction for the factor of stretching, the color and
the constant term. We considered during this adjustment a cosmology
with
respectively the correction for the factor of stretching, the color and
the constant term. We considered during this adjustment a cosmology
with ![]() .
.
 |