Contents

 $ \star $ Diagram of Hubble and relations of standardization

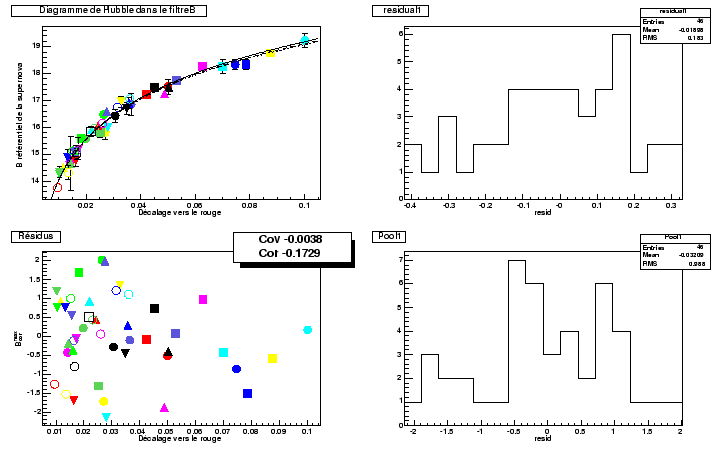
Figure 10.9 shows the diagram of Hubble obtained by adjusting the parameters of standardization  $ \beta$ . We find a dispersion 0.18 magnitude comparable with the dispersions observed for the other analyses (perlmutter1999 & riess1998).

Figure 10.9: Diagram of Hubble out of B corrected for the factor of stretching and the color. In top, on the left, the Diagram of Hubble. In bottom, on the left residuals with the diagram of Hubble in a number of  $ \sigma$ according to the redshift. In top on the right, the histogram of the residuals in magnitude, bellow on the right, the sweater of the residuals.
\begin{figure}\it\begin{center}\epsfig{file=Images/HubDiagBCorr.eps, width=16cm}\end{center}\end{figure}

We find finally the relation of following standardization:

$\displaystyle m_B(z) - 24.02~(0.07) = \mu(z,\Omega_{\rm M},\Omega_\Lambda ) + 0.78~(0.47) \times (1-s_B) + 3.04 ~(0.36) \times{(B-V)_{MAX}}$ (10.5)

The principal source of uncertainty comes from the contribution of the error on the color and the significant value of the parameter  $ \beta$ .


Contents
Julien Raux 2004-05-04