The zero of the time scale of the lightcurve correspond in general to the maximum of the lightcurve in the filter B We will take this convention in the continuation.
The
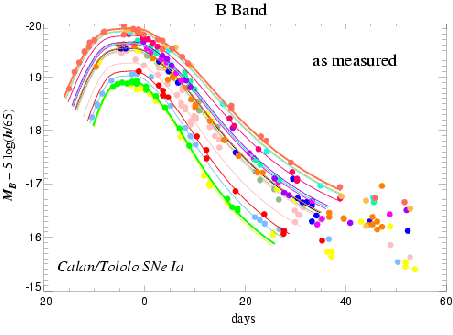
observations made it possible to show that the supernovæ present a very
great homogeneity out of B and out of V the dispersion of the
luminosity to the maximum is only 40% in these two bands. The curves of
light are characterized by a very fast rise which can be modelled by a
function in ![]() . This one lasts a score of days.
. This one lasts a score of days.
 |
The maximum is in general reached earlier out of I than out of B, the interval between the two usually observed being 5 days. In certain cases, this very different value perhaps. In the case of SN1991bg for example, the maximum out of I intervened 6 days after the maximum out of B.
To the maximum, the lightcurve can be modelled by a Gaussian curve or a polynomial of the second order. The curves of color, which were relatively constant, vary very quickly. The color of the supernova evolves of blue to the red.
After this maximum, the lightcurves in UV and blue decrease in an exponential way. On the other hand, the lightcurves in red and IR can present a second maximum. This one appears around 25 days after the maximum. There still some supernovæ are dissociated and do not present a second maximum, it is the case of SN1991bg.
Lastly, of around fifty at a few 120 days after the maximum, the rates of decrease become primarily identical for all the supernovæ. These rates are respectively 0.014, 0.028 and 0.042 magnitude per day out of B, V and I Once again, SN1991bg comes to make exception to this rule out of B and I On the other hand, the decrease out of V seems to be identical for all the supernovæ.
The IR observations are not enough numerous to allow this kind of estimate in JKH but it seems that the supernovæ follow also an exponential decay toa rate 0.04 magnitude per day.
Beyond, the supernovæ are almost extinct (150 days after the maximum, the luminosity was divided by 100) and disappear in the light from their galaxy host.
As the spectra and the lightcurves show it, there are great disparities in the quantity of energy produced according to the wavelength. It is to abstract themselves from this dependence and to include/understand the energetics of the supernovæ which one built a composite lightcurve, summons lightcurves in each spectral band. This lightcurve is called curved of bolometric light; it accounts for the total flux emitted by the supernova and of its evolution in time.