Star countings revealed at the beginning of the 20th century that the density of stars decrease with the distance to the sun. The sun not residing at the center of a star concentration, the astronomers quickly went to the obviousness that the light of the most distant objects were to be attenuated along the line of sight.
They noticed that the magnitudes of the objects observed using plate photographic were systematically larger than the magnitudes of the same objects estimated with eye . This made it possible to affirm that absorption is dependent the wavelength and that it is all the more large as the wavelength is short. Absorption `` reddened '' stars.
One quickly realized that the principle of absorption was in ![]() .
This decrease corresponds to the typical law of decrease of the star
spectra. The spectrum of stars having undergone an absorption are
similar to the star spectra of lower temperature .
.
This decrease corresponds to the typical law of decrease of the star
spectra. The spectrum of stars having undergone an absorption are
similar to the star spectra of lower temperature .
It is thus necessary to make photometry take it into account this effect in order to dérougir the studied objects.
In practice, it is necessary:
It is absorption and the diffusion on the interstellar matter clouds which are at the origin of reddening. The mechanism is rather similar to that met in the correction for the atmospheric extinction or correction of airmass which is discussed in Appendix 1.
The interstellar environment of the Milky Way is mainly made up of:
The density of the clouds varies between ![]() atoms per cubic meter and the relationship between the number of
particles of gas and dust is close to 100. Interstellar absorption is
mainly due to this second component.
atoms per cubic meter and the relationship between the number of
particles of gas and dust is close to 100. Interstellar absorption is
mainly due to this second component.
The degree of
extinction is proportional to the quantity of dust along the direction
of observation. If one considers an object of radiance ![]() where H is at the distance to the ground following the direction of observation:
where H is at the distance to the ground following the direction of observation:
where ![]() ):
):
While passing in magnitude, it comes:
 |
(2.29) |
where ![]() who describes a principle of absorption standardized to 1 in the
visible one, one thus has finally the law standardized in the visible
one:
who describes a principle of absorption standardized to 1 in the
visible one, one thus has finally the law standardized in the visible
one:
Where ![]() is absorption in the visible one in a given direction. As we will see
it in the continuation, there are charts of interstellar dust in three
dimensions which make it possible to know this thickness of dust.
is absorption in the visible one in a given direction. As we will see
it in the continuation, there are charts of interstellar dust in three
dimensions which make it possible to know this thickness of dust.
The principle of absorption ![]() in the visible part of the spectrum.
in the visible part of the spectrum.
In the case of the band-width filters broad (which are defined in Appendix A), one can write in an approximate way:
| (2.30) |
| (2.31) |
It is of use to define the quantity ![]() . This quantity dependent on the direction corresponds in practice to the quantity of dust along the line of sight.
. This quantity dependent on the direction corresponds in practice to the quantity of dust along the line of sight.
Dust absorbs and diffuses the optical light and re-emits in the remote
infra-red (in range 100-250 microns). The observations in remote
infra-red of the Galaxy by instrument DIRBE embarked on satellite COBE
made it possible to measure this emission with a high angular
resolution making it possible to build the interstellar charts of dust
(schlegel1998). Figure 2.5
shows the distribution of the infra-red emission and thus the quantity
of dust according to the direction of observation. In the continuation,
we will use these charts to estimate the excess of color ![]() .
.
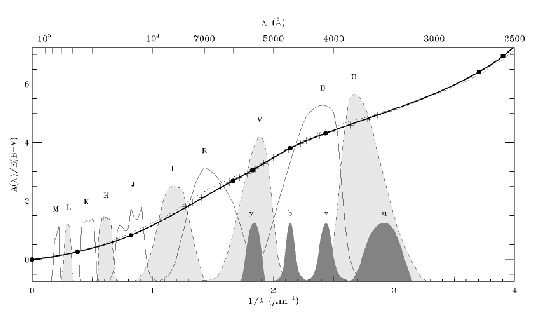
To determine absorption with another wavelength, one can in the same way define the excess of color compared to visible for all the wavelengths like:
| (2.32) |
While dividing by ![]() which allows the standardization of the principle of absorption, one a:
which allows the standardization of the principle of absorption, one a:
In practice the extinction law is measured by estimating the report/ratio ![]() a following the regulation of Cardelli1989.
a following the regulation of Cardelli1989.
 |
The knowledge of the extinction law and the excess of color ![]() thus makes it possible to determine the extinction in a given direction
and for a wavelength given in the standardization given by Cardelli1989
for the extinction law
thus makes it possible to determine the extinction in a given direction
and for a wavelength given in the standardization given by Cardelli1989
for the extinction law ![]() given by fitzpatrick1999:
given by fitzpatrick1999:
It is this law which will be used thereafter to make the corrections of Galactique extinction.