Contents
2001gq was discovered during program SCP of spring 2001 with
instrument CFH12K of the CFHT. It was detected on April 15 and was
confirmed April the 17 and 19.
Its spectral identification and the measurement of its redshift (0.671) was obtained thanks to instruments LRIS figure ). The measurement of its redshift was obtained thanks to the lines of its galaxy host.
This supernova was discovered a few days before its maximum of
luminosity, it gained from 5 points of space follow-up in R and I and
of a point in R and I obtained with the Fors-1 instrument of telescope
VLT (table B.18 ).
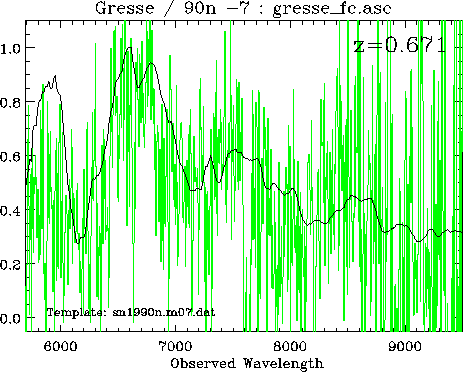
Appear B.13: In green, the
spectrum of 2001gq. This spectrum was obtained using the Keck telescope
and from the spectrograph on scale ESI on April 22, 2001. The duration
is 1800 seconds. In black, the spectrum of the close supernova 1990N
observed 7 days before the maximum. To note, the spectrum of 2001gy is
rééchantilloné by steps of 5 Å
 |
Appear B.14: Supernova
2001gq in the band R observed by the Hubble telescope on the left and
the CFHT on the right, the magnitudes of some objects of the field are
presented in B.19 table .
|
B.18 table: Summary of the observations with the space telescope Hubble of 2001gq.
| Instrument |
Go back to observationa |
filtreb |
Exposure C |
|
|
|
| HstWfpc2 |
52039.37 |
F814W |
2400 |
|
|
|
| HstWfpc2 |
52047.60 |
F814W |
2400 |
|
|
|
| HstWfpc2 |
52053.62 |
F814W |
2400 |
|
|
|
| HstWfpc2 |
52066.53 |
F814W |
4800 |
|
|
|
| HstWfpc2 |
52039.31 |
F675W |
2300 |
|
|
|
| HstWfpc2 |
52047.54 |
F675W |
2300 |
|
|
|
| HstWfpc2 |
52053.56 |
F675W |
2300 |
|
|
|
| HstWfpc2 |
52066.40 |
F675W |
4700 |
|
|
|
aDate Julienne  second of reference without the supernova. second of reference without the supernova. |
B.19 table: Magnitudes of some stars of the field of 2001gq.
| Stars |
I |
R |
| With |
20.13  0.03 0.03 |
20.13 0.03 |
| B |
20.14 0.05 |
20.14 0.05 |
| C |
20.84 0.05 |
20.84 0.05 |
| D |
19.18 0.02 |
19.18 0.02 |
| E |
19.07 0.04 |
19.07 0.04 |
| F |
20.85 0.08 |
20.85 0.08 |
| G |
21.93 0.03 |
21.93 0.03 |
| H |
21.26 0.06 |
21.26 0.06 |
| I |
20.00 0.02 |
20.00 0.02 |
|
B.20 table: Curve of light of 2001gq in the band R
|
|
B.21 table: Curve of light of 2001gq in band I
|
|
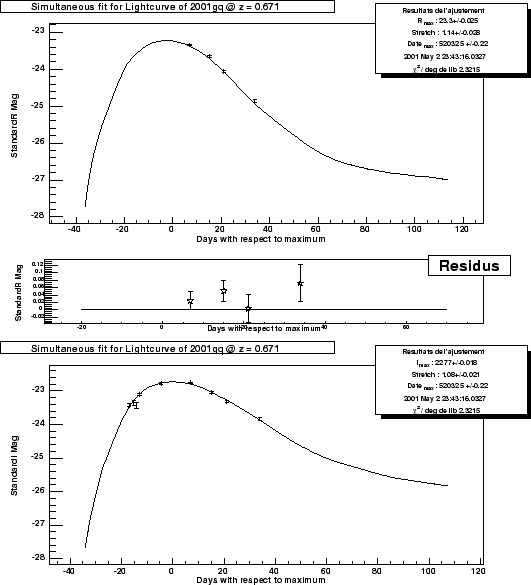
Appear B.15: Curves of light of 2001gq in standard magnitudes in the filters R and I
 |
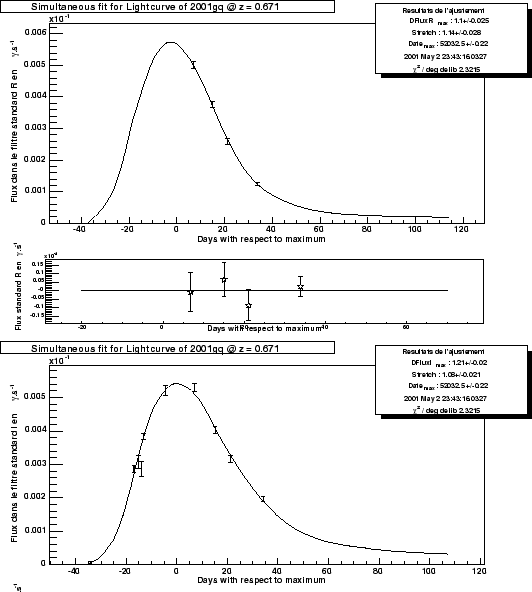
Appear B.16: Curves of light of 2001gq in standard fluxes in the filters R and I
 |
Contents Julien Raux 2004-05-04