Contents

2001go

This supernova was discovered at the time of the countryside of spring 2001 with instrument CFH12K with the CFHT. It was detected on April 16, then confirmed on April 20.

Its spectral identification and the measurement of its redshift was obtained thanks to the Fors-1 instrument of the VLT (B.9 B.13 ) at the same time space with 5 points measured in R and I and on the ground with the measurements made with the Fors-1 instruments from the VLT (in R) and SUSI2 of the NTT (in R and I).

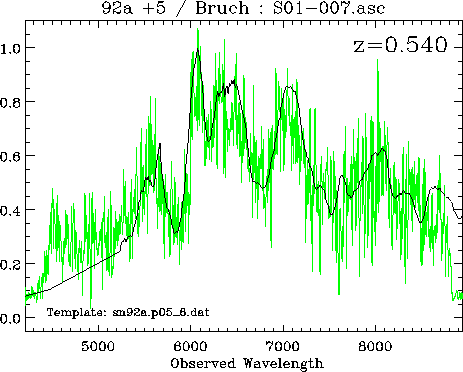
Appear B.9: In green, the spectrum of 2001go. This spectrum was taken with the VLT and the spectrograph long slit FORS1 on April 21. The duration is 2400 seconds. The redshift was given by measuring the lines coming from the galaxy host.
\begin{figure}\it\begin{center}\epsfig{file=Images/2001gospectre, width=12cm} \end{center}\end{figure}


B.12 table: Summary of the observations of 2001go.
Telescope Instrument Go back to observationa filter Expositionb seeingc
CFHT Cfht12K 51999.47 I 9900 0.74
CFHT Cfht12K 52016.49 I 9900 0.72
CFHT Cfht12K 52020.38 I 2640 0.65
CFHT Cfht12K 52350.57 \dag I 3600 0.90
CFHT Cfht12K 52353.55 \dag I 7200 0.80
CFHT Cfht12K 52377.58 \dag I 3600 0.72
CFHT Cfht12K 52378.52 \dag I 3600 0.82
CFHT Cfht12K 52382.52 \dag I 1800 0.83
CFHT Cfht12K 52385.49 \dag I 1800 0.85
CFHT Cfht12K 52387.37 \dag I 1800 0.84
CFHT Cfht12K 52407.29 \dag I 3600 0.71
CFHT Cfht12K 52413.31 \dag I 1800 0.82
CFHT Cfht12K 52416.30 \dag I 1800 0.63
NTT NttSusi 52026.15 \dag I 4800 0.64
NTT NttSusi 52026.10 R 2400 0.63
VLT VltFors1 52057.00 R 1199 0.71
VLT VltFors1 52080.00 R 5399 0.49
CFHT Cfht12K 52350.60 \dag R 1200 1.01
CFHT Cfht12K 52353.59 \dag R 2400 0.93
CFHT Cfht12K 52377.61 \dag R 1200 0.88
CFHT Cfht12K 52378.55 \dag R 1200 0.87
CFHT Cfht12K 52382.54 \dag R 600 0.89
CFHT Cfht12K 52385.51 \dag R 600 0.82
CFHT Cfht12K 52387.39 \dag R 600 0.83
CFHT Cfht12K 52407.31 \dag R 1200 0.76
CFHT Cfht12K 52413.32 \dag R 600 0.79
CFHT Cfht12K 52416.32 \dag R 600 0.65

aDate Julienne  \dag Images of reference without the supernova.


Appear B.10: Supernova 2001go in the band R observed by the Hubble telescope on the left and the CFHT on the right, the magnitudes of some objects of the field are presented in B.14 table .


B.13 table: Summary of the observations with the space telescope Hubble of 2001go.
Instrument Go back to observationa filtreb Exposure C
HstWfpc2 52029.76 F814W 2000
HstWfpc2 52037.57 F814W 2400
HstWfpc2 52047.47 F814W 2400
HstWfpc2 52054.09 F814W 2400
HstWfpc2 52065.86 F814W 4800
HstACS 52765.16 \dag F814W 950
HstWfpc2 52029.74 F675W 2200
HstWfpc2 52037.50 F675W 2300
HstWfpc2 52047.40 F675W 2300
HstWfpc2 52054.02 F675W 2300
HstWfpc2 52065.73 F675W 4700
HstACS 52765.10 \dag F625W 950

aDate Julienne  \dag second of reference without the supernova.


B.14 table: Magnitudes of some stars of the field of 2001go.
Stars I R
With 17.54 $ \pm$ 0.02 17.54  $ \pm$ 0.02
B 21.05 $ \pm$ 0.09 21.05  $ \pm$ 0.09
C 18.47 $ \pm$ 0.02 18.47  $ \pm$ 0.02
D 18.81 $ \pm$ 0.01 18.81  $ \pm$ 0.01
E 21.08 $ \pm$ 0.03 21.08  $ \pm$ 0.03
F 19.70 $ \pm$ 0.02 19.70  $ \pm$ 0.02
G 18.98 $ \pm$ 0.01 18.98  $ \pm$ 0.01
H 18.51 $ \pm$ 0.02 18.51  $ \pm$ 0.02
I 21.19 $ \pm$ 0.05 21.19  $ \pm$ 0.05


B.15 table: Curve of light of 2001go in the band R
Phase \dag R  \ddag
52029.74(0.01) 23.21(0.02)23.32
52037.50(0.01) 23.83(0.03)23.88
52047.40(0.01) 24.42(0.05)24.47
52054.03(0.01) 24.70(0.07)
52065.73(0.01) 25.27(0.08)
 \ddag standard Magnitude in the filter R


B.16 table: Curve of light of 2001go in band I
Phase \dag I  \ddag
52029.76(0.01) 22.79(0.03)c
52037.57(0.01) 23.19(0.03)c
52047.47(0.01) 23.51(0.04)c
52054.09(0.01) 23.89(0.06)
52065.86(0.01) 24.45(0.07)
52020.40(0.01) 22.44(0.02)a
52026.10(0.01) 22.55(0.03)b
52016.50(0.01) 22.41(0.02)a
51999.50(0.01) 23.05(0.03)
 \ddag standard Magnitude in filter I aObservations with the CFHT bObservations with the NTT OBSERVATIONS with HST


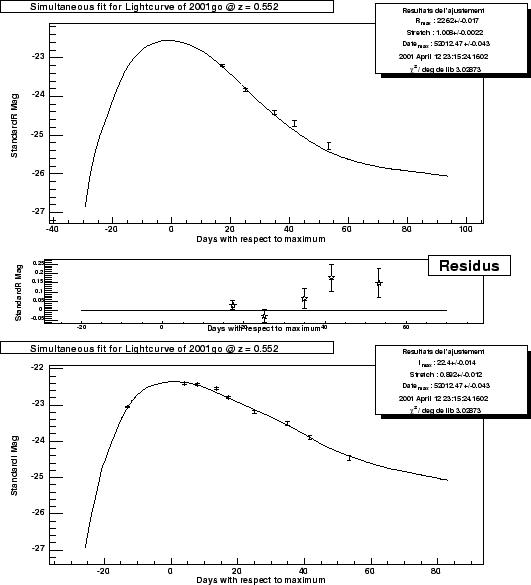
Appear B.11: Curves of light of 2001go in standard magnitudes in the filters R and I
\begin{figure}\it\begin{center}
\epsfig{file=Images/2001go_LC_R.eps, width=12cm}...
...sfig{file=Images/2001go_LC_I.eps, width=12cm}\vskip 2cm
\end{center}\end{figure}
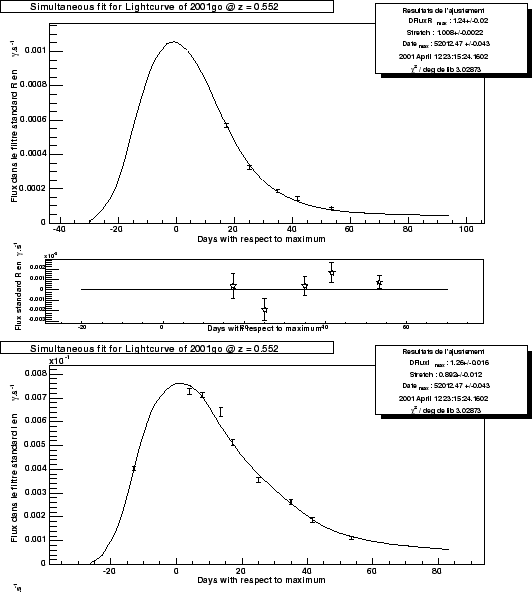
Appear B.12: Curves of light of 2001go in standard fluxes in the filters R and I
\begin{figure}\it\begin{center}
\epsfig{file=Images/2001go_LC_flux_R.eps, width=...
...file=Images/2001go_LC_flux_I.eps, width=12cm}\vskip 2cm
\end{center}\end{figure}


Contents
Julien Raux 2004-05-04