Contents
This supernova was discovered at the time of the research
campaign of spring 2001 by instrument CFH12K with the CFHT. It was
detected on April 16, on 2001, then confirmed April 20.
Its spectrum (B.5
of Keck. An exposure time of 2h allowed its identification and the
measurement of its redshift (1.1) by using the lines of
the supernova.
A line which could correspond to a
galactic line was observed in the spectrum indicating a shift towards
the red of 1.12 in very good agreement with that measured on the
spectrum of the supernova.
It was then observed with
5 resumptions out of I and a resumption in Z by the space telescope
Hubble starting from its maximum of luminosity (B.7 table ).
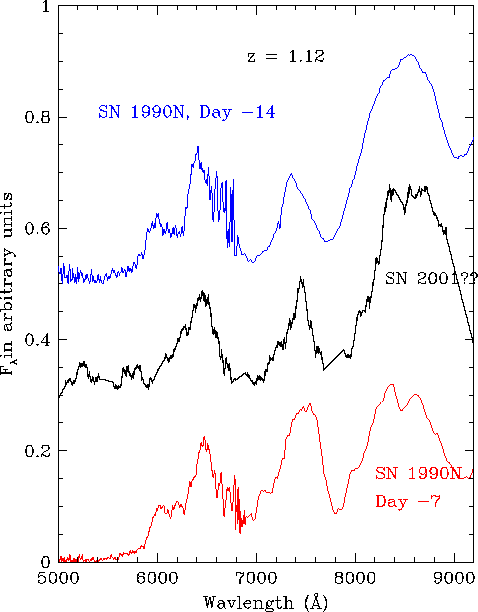
Appear B.5: In black, the
spectrum of 2001gn. This spectrum was observed the 23 and on April 24,
2001 with the Keck telescope and the spectrograph scale ESI. The time
of integration is  seconds distributed over the two nights. The spectrum is compared with
the spectra of 1990N with various phases (respectively 7 and 14 days
before the maximum in red and blue). To note, the spectrum was smoothed
to emphasize the lines characteristic of the supernova (broad lines) to
the detriment of the narrow lines.
seconds distributed over the two nights. The spectrum is compared with
the spectra of 1990N with various phases (respectively 7 and 14 days
before the maximum in red and blue). To note, the spectrum was smoothed
to emphasize the lines characteristic of the supernova (broad lines) to
the detriment of the narrow lines.
 |
B.8 table: Summary of the observations with the space telescope Hubble of 2001gn.
| Instrument |
Go back to observationa |
filtreb |
Exposure C |
|
|
|
| HstWfpc2 |
52030.54 |
F814W |
2300 |
|
|
|
| HstWfpc2 |
52040.51 |
F814W |
3600 |
|
|
|
| HstWfpc2 |
52051.35 |
F814W |
4700 |
|
|
|
| HstWfpc2 |
52064.53 |
F814W |
7100 |
|
|
|
| HstWfpc2 |
52078.37 |
F814W |
7200 |
|
|
|
| HstACS |
52765.89 |
F814W |
946 |
|
|
|
| HstWfpc2 |
52036.36 |
F850LP |
7100 |
|
|
|
| HstACS |
52765.95 |
F850LP |
946 |
|
|
|
aDate Julienne second of reference without the supernova.
|
Appear B.6: Supernova
2001gn in band I observed by the Hubble telescope on the left and the
CFHT on the right, the magnitudes of some objects of the field are
presented in B.9 table .
|
B.9 table: Magnitudes of some stars of the field of 2001gn.
| Stars |
I |
R |
| With |
18.28  0.01 0.01 |
- |
| B |
19.52 0.01 |
- |
| C |
17.14 0.06 |
- |
| D |
19.93 0.02 |
- |
| E |
20.40 0.02 |
- |
| F |
20.21 0.02 |
- |
|
B.10 table: Curve of light of 2001gn in band I
|
|
B.11 table: Curve of light of 2001gn in band Z the points all are measured with the HST.
| Phase |
Z  |
|
52036.37(0.01) |
23.59(0.11) |
standard Magnitude in filter Z |
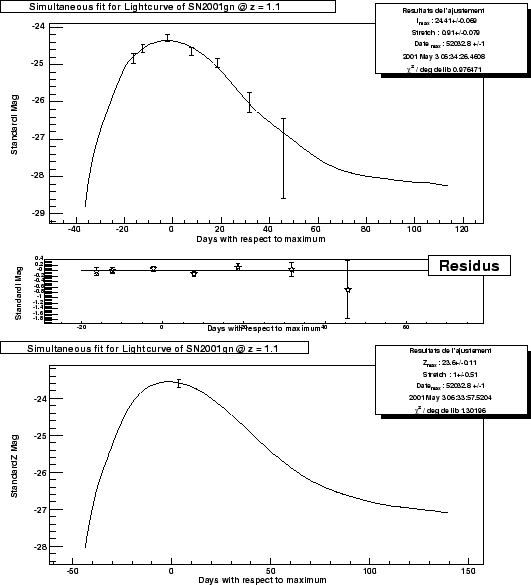
Appear B.7: Curves of light of 2001gn in standard magnitudes in the filters R and I
 |
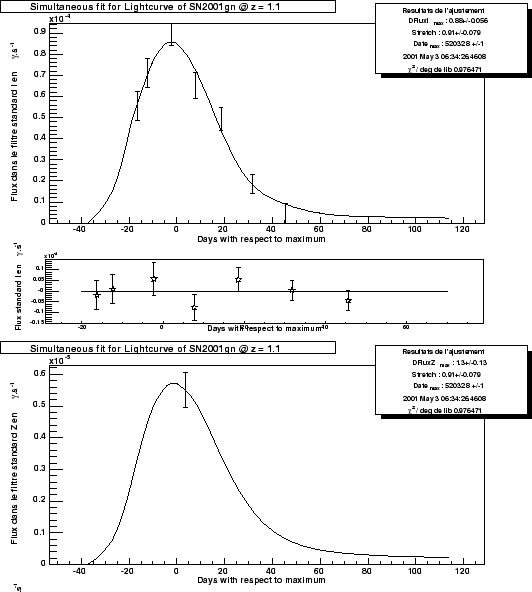
Appear B.8: Curves of light of 2001gn in standard fluxes in the filters R and I
 |
Contents Julien Raux 2004-05-04