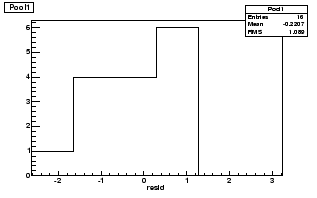
Figure 10.23 presents the sweater of the residuals of our diagram of Hubble. We note that the sweater with an average and a dispersion respectively close to 0 and 1. This indicates to us that our result is not biased and that the errors were correctly evaluated.
 |