As previously, we adjusted the relation in the band U We have, this time, fixed the value of the parameter ![]()
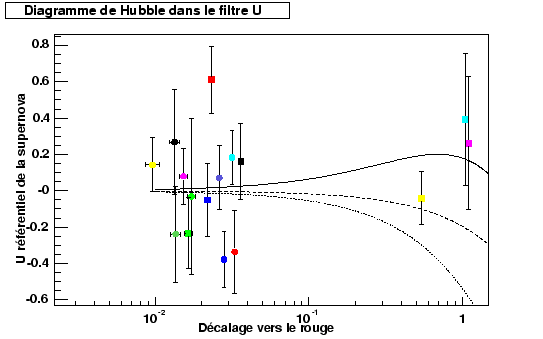
Figures 10.21 respectively show the diagram of Hubble and the diagram of residuals magnitudes out of U, compared to an empty model of universes, obtained by this adjustment. The line in full feature represents each time the model of universe with cosmological constant.
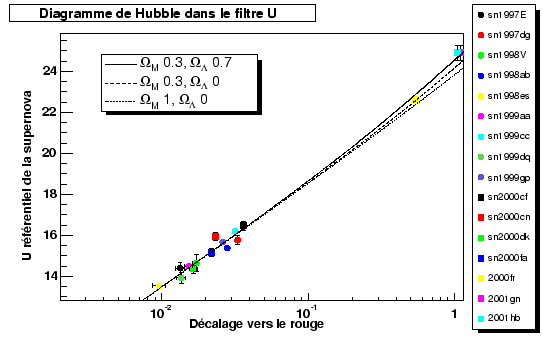 |
The value of ![]() data by the adjustment is:
data by the adjustment is:
| (10.8) |
The value of ![]() data by this adjustment is thus 0.78. That is to say a good agreement
with measurement that we found previously and with measurements of
(riess1998, perlmutter1999, tonry2003 and knop2003). Moreover, this
analysis rests on a batch of data completely independent of the
preceding analyses, by considering a new estimator of distance
(magnitude in the filter U to the maximum).
data by this adjustment is thus 0.78. That is to say a good agreement
with measurement that we found previously and with measurements of
(riess1998, perlmutter1999, tonry2003 and knop2003). Moreover, this
analysis rests on a batch of data completely independent of the
preceding analyses, by considering a new estimator of distance
(magnitude in the filter U to the maximum).
The errors here are dominated by the measuring accuracy the magnitude out of U to the maximum (0.04 and 0.07 magnitude for both supernovæ most remote) and uncertainty over the value of the factor of spreading out (0.08 and 0.04 for 2001gn and 2001gy).
 |