Contents
Figure 10.18: Residuals with
the diagram of Hubble for 46 supernovæ close and 4 supernovæ remote
according to the parameters to the supernovæ: the redshift
in top on the left, the factor of stretching in top on the right,  bellow on the right.
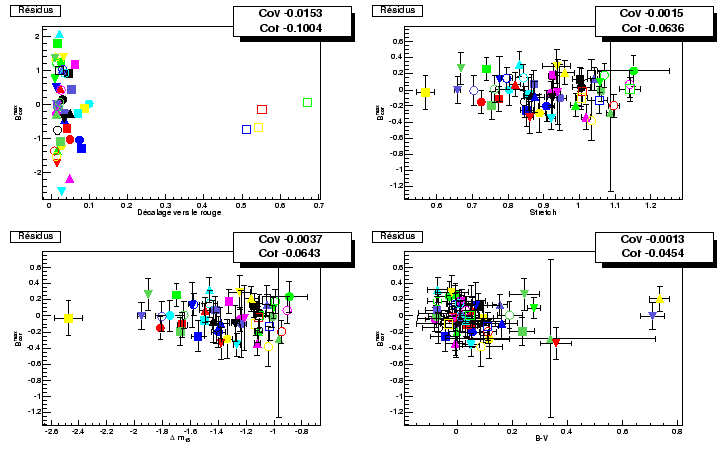 |
Figure 10.18
in top on the left represents the residuals with the diagram of Hubble
according to the redshift, we see that there is not
residual correlation. There is thus no systematic bias according to the
redshift.
Julien Raux 2004-05-04