We are from now on in measurement, with Nos 4 close supernovæ remote and Nos 46 supernovæ, to consider the parameters cosmological.
For that, we use the relation 10.3
which we adjust with our batch of 50 supernovæ. Contrary to the
preceding diagrams of Hubble, the cosmological parameters are adjusted.
Nevertheless, we have only one batch of data reduced, we thus fixed the
relation enters ![]() , that is to say between 0 and 3.
, that is to say between 0 and 3.
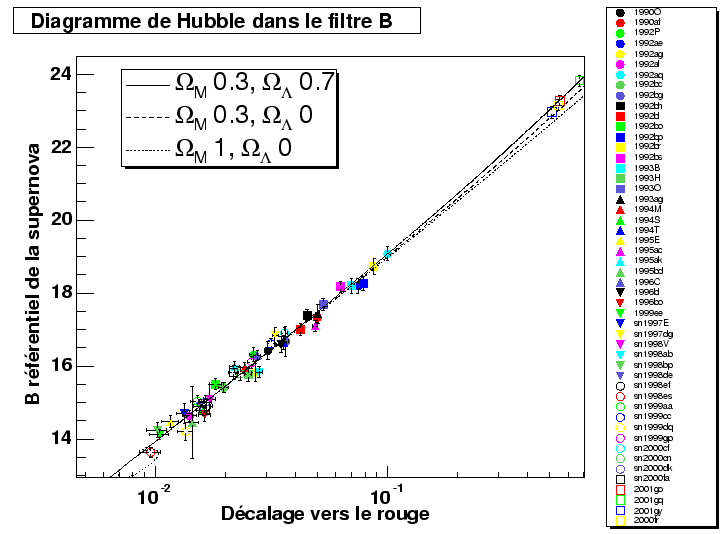 |
Figure 10.16
presents the diagram of Hubble result of the adjustment. The line in
full feature represents the currently favoured universe by the
observations (knop2003, spergel2003), that is to say respective values
from ![]() 0.28 and 0.72.
0.28 and 0.72.
We note that Nos 4 supernovæ support these models. The result of the adjustment gives us:
| (10.7) |
 |