Figure 10.14 shows the result of the adjustment of the diagram of Hubble out of U by using the relations of standardization. We again supposed an intrinsic dispersion 0.11 magnitude to the maximum. Final dispersion that we obtain is 0.16, that is to say appreciably the same one as in the filter B.
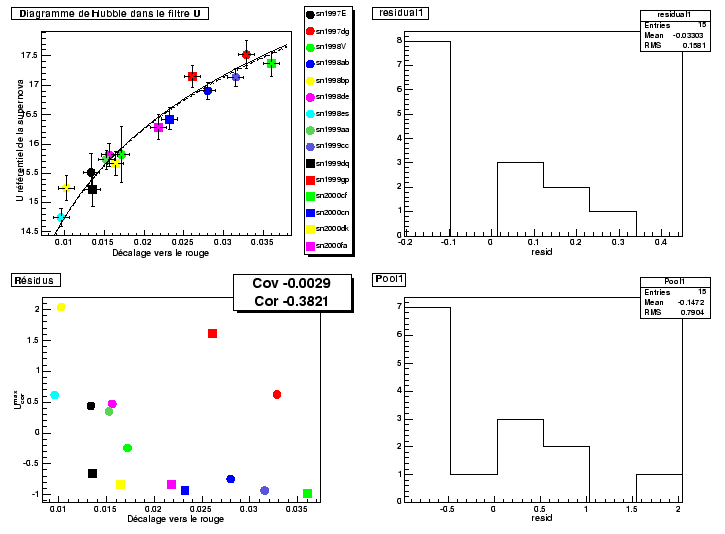 |
We find the relation of following calibration:
We find values of the parameters of standardization close to those given for the analysis out of B Once again, it is the error on the color which represents the principal contribution to total uncertainty.
It thus seems that the supernovæ are standard candles out of U allowing of measurements of distance with a precision equivalent to measurements using measurements out of B the use of the observations out of U thus appears to be an interesting tool to make estimates of distance from supernovæ of the Ia type.
We thus have two estimators of distance. The supernovæ which made it possible to build the diagram of Hubble out of U were observed out of U, B and V We can thus compare the estimates of distance from these supernovæ given by the two methods.