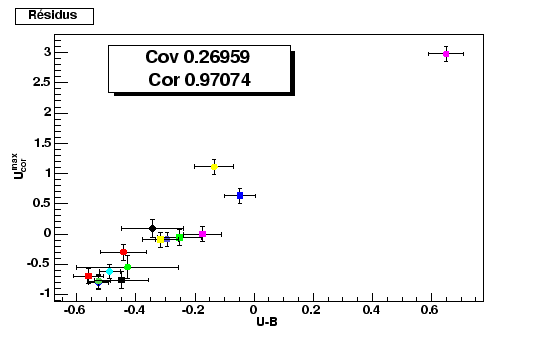
Figure 10.13 shows the correlation between the residuals to the diagram of Hubble with . Once again, we see that the least luminous supernovæ are reddest.
Figure 10.13: Correlation enters the residuals to the diagram of Hubble out of U for and the color (U-b)