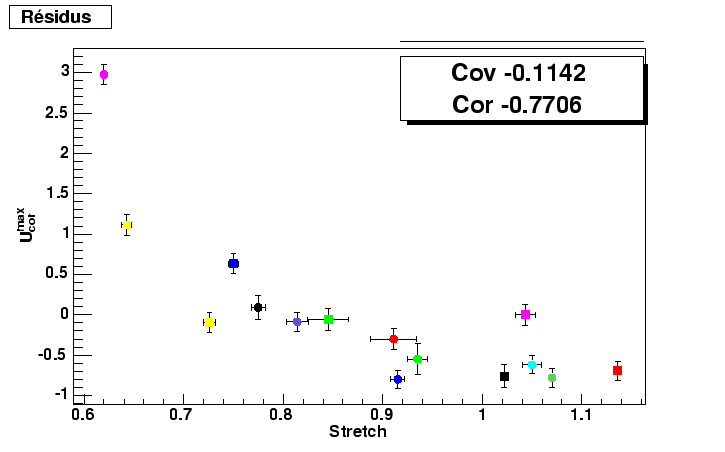
Figure 10.12 shows the correlation between the residuals of the diagram of Hubble out of U for ![]() and the factor of stretching. We observe the type of correlation that
in band b: the supernovæ whose factor of stretching is smallest are
also most luminous.
and the factor of stretching. We observe the type of correlation that
in band b: the supernovæ whose factor of stretching is smallest are
also most luminous.
 |