Close supernovæ that we used come mainly from the research carried out within the framework of Calàn-Tololo Supernovae Survey (hamuy1996c), of CFA between 1993 and 1996 (riess1999), and between 1997 and 2000 (jha2002). We added to this batch about fifteen supernovæ resulting from various bibliographical sources.
The characteristics of these supernovæ are detailed in C.1 table .
The redshifts (observed and corrected for the movement of
our galaxy compared to the CMB) and excesses of Galactique color (![]() ) were given thanks to the astronomical search engine NED .
We, for checking, calculated the values of excesses of color by using
the charts of Galactiques dust resulting from schlegel1998, we checked
that the values are quite identical.
) were given thanks to the astronomical search engine NED .
We, for checking, calculated the values of excesses of color by using
the charts of Galactiques dust resulting from schlegel1998, we checked
that the values are quite identical.
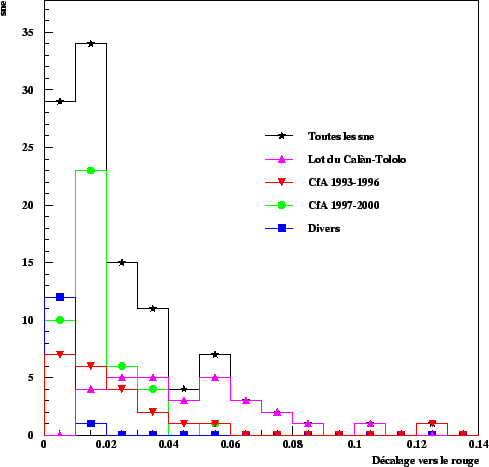
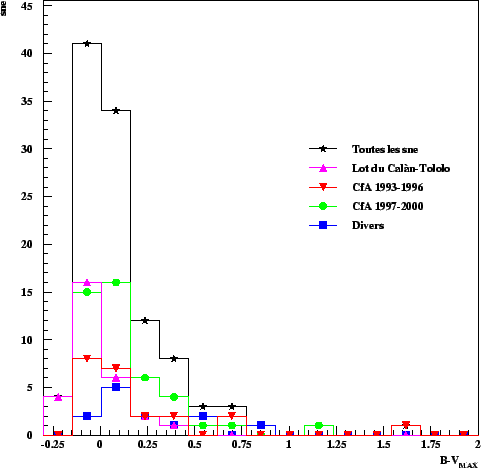
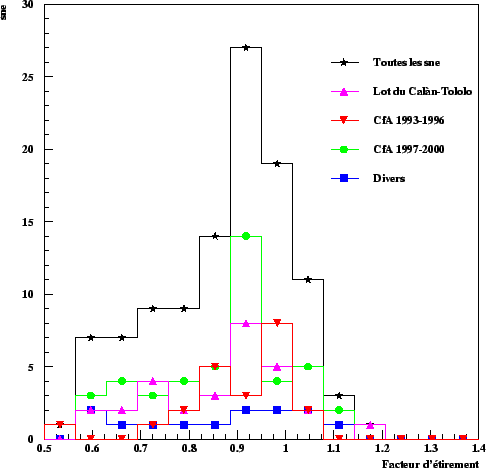
Figures 10.3 present the distributions of the redshifts, color (![]() ) and a panel of factor of stretching ranging between 0.6 and 1.2.
) and a panel of factor of stretching ranging between 0.6 and 1.2.
 |