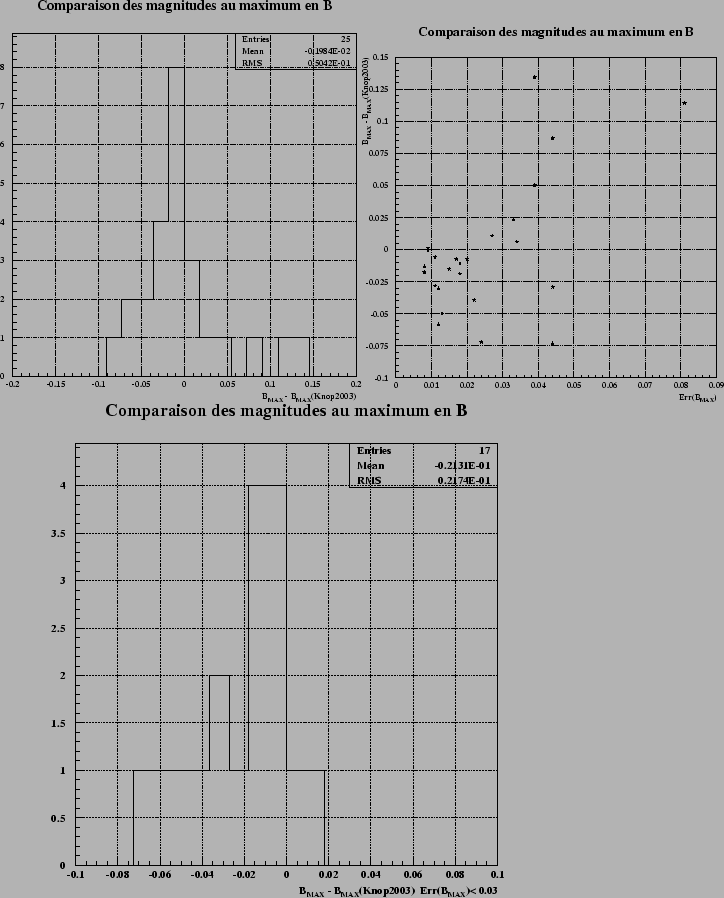
Figure 9.9 shows the comparison between the magnitudes in the filter B obtained by using our model and the estimate of knop2003. The figure of left presents a certain number of supernovæ for which flux is over-estimated in our analysis, the figure of the center shows that they are the supernovæ for which the error to the measure is largest in general. They are the supernovæ whose observations were begun after the maximum of luminosity.
As we saw, the maximum of the curve of light of goldhaber2001 is lower than it our; the extrapolation of the lightcurve to the maximum thus gives a larger magnitude to the maximum.
Lastly, the figure of right-hand side shows the comparison magnitudes for the supernovæ whose error on photometry is lower than 0.03 magnitudes.
 |