Contents
Figure 8.20 shows the comparison of one of the images of follow-ups of 2001gn with the image of aligned reference ACS.
In this case, we estimated the flux of the supernova and of the galaxy
on the images of follow-ups by using a small opening (between 3 and 5
pixels of ray) centered on the couple, makes the same estimate by
centering the ray on the galaxy on the image. Two fluxes thus estimated
were withdrawn, the independent errors are added in squaring.
Figure 8.18: Comparison of
an image of follow-up and reference taken with HST for 2001hb. One
notices that the galaxy host is too weak to be visible on the image of
reference which presents a much better signal report/ratio on total
noise.
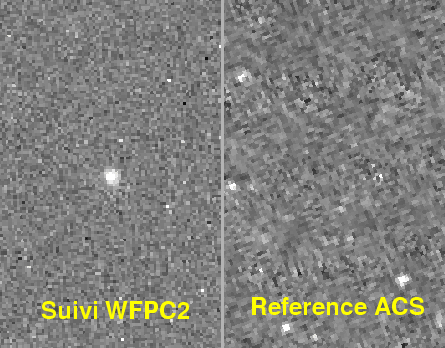 |
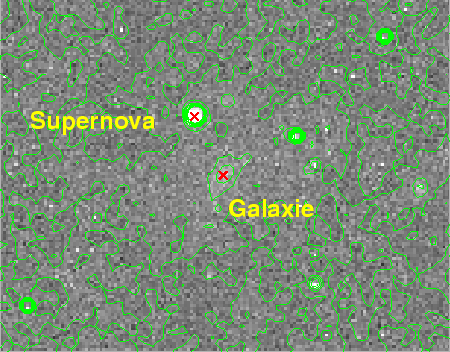
Figure 8.19: Image of follow-up taken with HST for 2000fr, the supernova and its galaxy host are definitely separate.
 |
For weak fluxes, the principal source of the fluctuations comes
from the basic light of sky. It is thus necessary to minimize the ray
to integrate less possible flux of sky. However, this ray must also
encircle to it quasi totality of fluxes of the Galaxy and the supernova.
This method was applied in the case of 2001gn. Figure 8.21 shows the pixels contained in a radius of 5 pixels.
Figure 8.20: Comparison of an image of follow-up and reference taken with HST for 2001gn
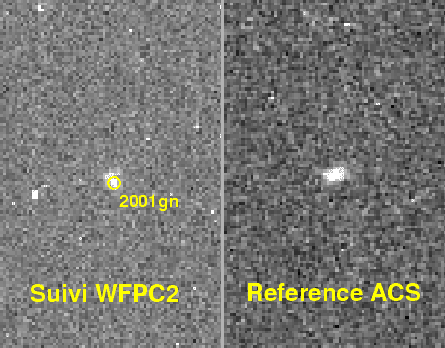 |
Figure 8.21: Pixels
contained in a radius of 5 pixels for the images of follow-up of 2001
gn. The contributions to the flux of the galaxy host and the supernova
are not discernible any more apart from this aperture.
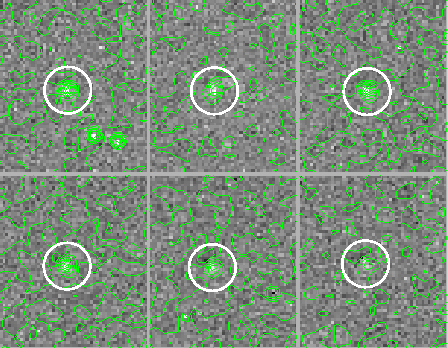 |
Figure 8.23 shows that the use of smaller openings tends has to over-estimate the values of flux.
Figure 8.22: Evolution of the flux of 2001gn according to the aperture used, each code of color corresponds to one time of follow-up
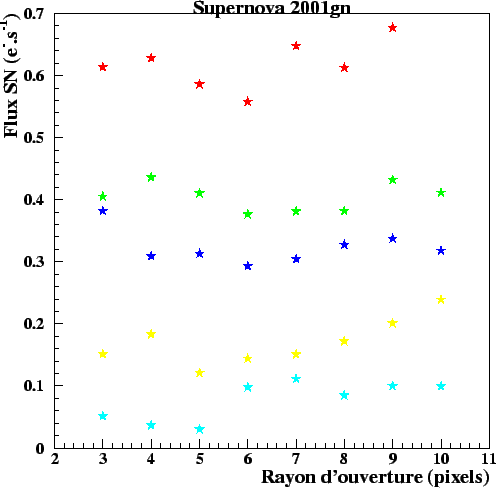 |
Figure 8.23: Evolution of
the residuals of subtraction of fluxes on the images of follow-up and the
image of reference of a star fiducial according to the aperture
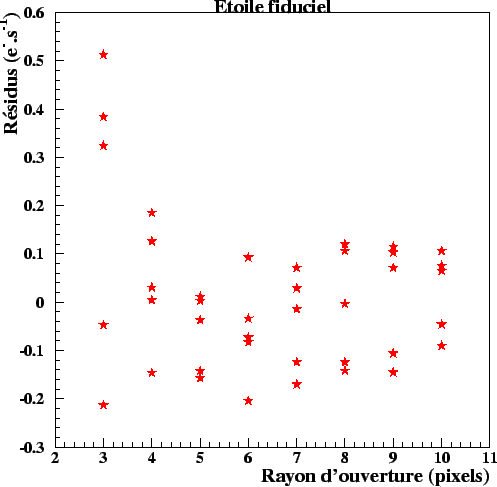 |
Contents Julien Raux 2004-05-04