Contents

Comparison of the methods

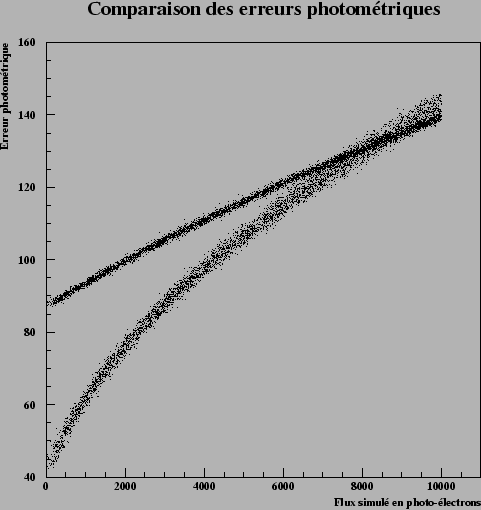
Figure 8.13 shows the photometric errors awaited according to simulated flux. We see that for fluxes higher than 6000 electrons (the typical flux of our supernovæ to redshifts around 0.5) the errors for the two methods are comparable. We will thus use the fluxes of opening not biased in this configuration.

Figure 8.13: Comparison of the photometric errors for photometries of PSF (curve of bottom) and of opening (curve top) according to the flux simulated in camera PC.
\begin{figure}\it\begin{center}
\epsfig{file=Images/FakesCompErrors.eps, width=12cm}\end{center}\end{figure}


Julien Raux 2004-05-04