Contents
This stage consists in bringing the images of the subtractions
to the screen to check that very was held well. The majority of
detections are bad subtractions (which present a profile in ying-yang)
and are very easy to eliminate. Figures 7.23
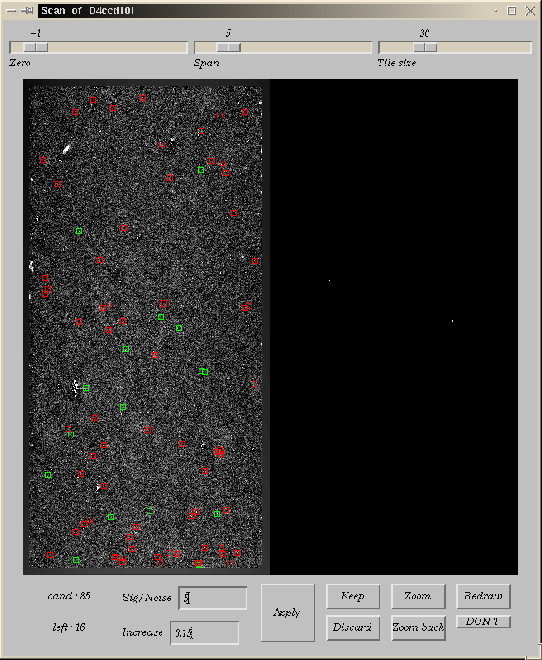
present the tools used to bring the images to the screen. The first
figure presents a visualization of the complete subtraction for a CCD.
The second figure shows a zoom on a particular candidate.
Figure 7.22: This figure
shows the tool used for the visual inspection of the candidates. The
framed candidates of green correspond to the candidates with the top of
the cuts. This interactive program allows zoomer and to post the
details related with a candidate. The zoom is presented figure 7.23
 |
The selected candidates are preserved then classified according to certain characteristics:
- The signal on noise.
- The rate of increase in light (the supernovæ of the Ia type have luminosities comparable with their galaxy host).
- The distance to the galaxy host (more this one is large plus the spectroscopic observation is facilitated).
The best candidates will be observed with a spectrograph.
Figure 7.23: Zoom on a
candidate in the program of visualization. In top, of left on the
right, zooms on the position of the candidate of the image of
reference, the image of research and the two partial subtractions. In
bottom on the left, the subtraction and on the line the `` scores '' of
this candidate: positions, signal reports/ratios on noise, rate of
increase and distance in association enters the two partial
subtractions.
 |
Figure 7.24: Card-index
identity of a candidate selected for the spectroscopy. Of left on the
right, zooms on the candidate of the images of reference, of research,
two partial subtractions and the subtraction. Below, the `` scores ''
of this candidate: its position, its signal on noise on the three
subtractions, its flux, its magnitude, its rate of increase, its
co-ordinates celestial and outdistance association between the two
subtractions in pixels.
 |
Contents Julien Raux 2004-05-04