Contents
We thus have now the chart of possible the artifacts, they will
be put in veto during the construction of the major images. As the
weights of the images now will vary pixel with pixel, simplest is of
the encoder in an image:
 |
(7.21) |
in which the died pixels, containing the cosmic ones or satellites are put at zero. Figure 7.16 presents an example of chart of weight. We lay out now of all the ingredients to build an optimal major image and without artifacts.
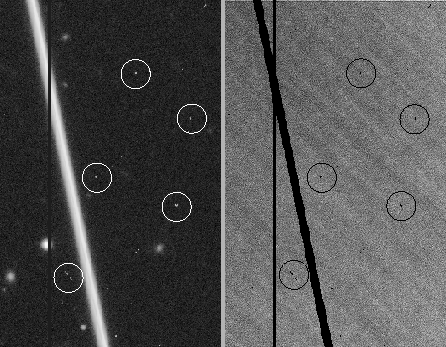
Figure 7.16: This figure
presents part of the chart of weight of an image taken in the filter R
with MegaCam in June 2003. At left a detail of the image corrected for
the quantum effectiveness with withdrawn bottom is presented, on the
right its chart of weight. In particular, we see that the dead column
(the vertical line in the image), the satellite (the oblique line) and
the pixels containing of cosmic (surrounded in white on the image and
black on the chart of weight) are put at zero in the chart of weight.
 |
Contents Julien Raux 2004-05-04