 |
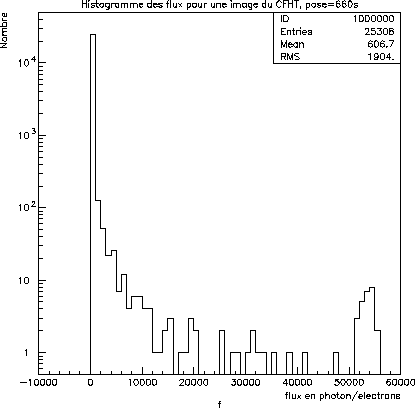
The value of saturation is given starting from the pixels of the image. One builds a histogram of the values of the pixels and one seeks the last local maximum (Figure 7.10 ) which corresponds to the value of saturation. It is this value of the saturation which allows the construction of the chart of saturation. The pixels declared saturated are not only the pixels which exceed the level of saturation but all the pixels contiguous to an actually saturated pixel. The saturated pixels can indeed flee in the adjacent pixels returning flux in these pixels unusable, along the columns in the case of camera CFH12K.
|