CCDs are composed in the case of the CFH12K of more than 8
million pixels. Even if the pixels are in general homogeneous for a
CCD, they present variations of quantum effectiveness of the order of ![]() .
The stage of quantum correction of effectiveness thus consists in
standardizing all the pixels with the same effectiveness. With this
intention, it is necessary to build the chart of the relative quantum
effectiveness of each CCD, a `` flat '' to return the image punt, one
carries out the `` flatfielding ' '. Other factors which the quantum
effectiveness enter these images of calibration (variations of surface
of pixel with pixel, for example), but the method employed to build
them ensures that the images gauged thus will contain the fluxes
expressed in the same unit for all the pixels.
.
The stage of quantum correction of effectiveness thus consists in
standardizing all the pixels with the same effectiveness. With this
intention, it is necessary to build the chart of the relative quantum
effectiveness of each CCD, a `` flat '' to return the image punt, one
carries out the `` flatfielding ' '. Other factors which the quantum
effectiveness enter these images of calibration (variations of surface
of pixel with pixel, for example), but the method employed to build
them ensures that the images gauged thus will contain the fluxes
expressed in the same unit for all the pixels.
Two methods are employed to build the quantum charts of effectiveness of CCDs. They leave the same basic idea: to observe a uniform light to know the response of the camera in each filter of observation.
In the first case, one uses images of the zenith taken in the twilight or the dawn. At this time, the sky is of luminosity roughly uniform.
The second method uses the images of science which were taken during the nights and uses the light of the bottom of sky.
In both cases, many stars are present on the images. One thus uses a median on a great number of images to build the quantum chart of effectiveness. With this intention, one standardizes the bottom of all the images to the unit then one calculates for each pixel the median of the values which it takes on each image.
It will be noticed that the chart of effectiveness does not relate absolute but to the average of the CCD In particular, the number of ADU (a number of logical units or photon-electrons if one multiplies by the gain of the instrument) will not be the number of incidental photons but this number multiplied by the average quantum effectiveness of the CCD. The correspondence between the number of ADU or photoelectrons will be made at the time of the calibration of the images. It is necessary well to keep in mind that the units (ADU or photon-electrons) of the images are not the physical units of flux on the sky.
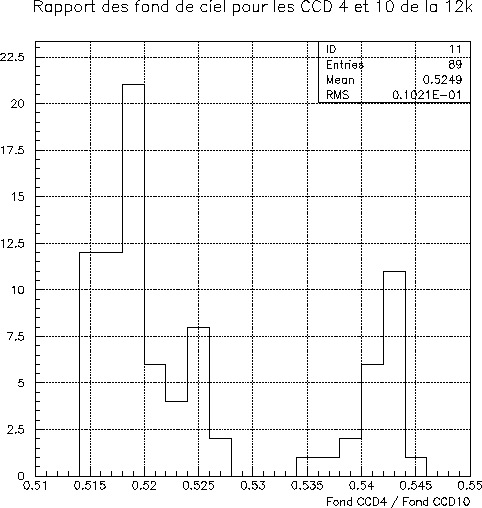
All the images of science are thus corrected while dividing by this chart. The choice of the method generally comes from the experimental constraints. It depends on the number of images of each type taken in the filter considered. It is often preferable to take the images of twilight whose light comes mainly from the sun (its spectrum being closer to the spectrum of stars observed than that of the sky). Figure 7.7 shows the reports/ratios of the funds of sky for rough images of science, standard stars (with short exposure times, 5s) and twilight in filter I We see appearing two peaks which correspond to the images of science and standard corresponding to the night bottom of sky, and with the images of twilight whose bottom is primarily due to the sun.
This systematic difference is the manifestation of the difference between the variations of quantum effectiveness according to the wavelength of both CCDs considered. We will see in the continuation that these differences will have to be taken into account during the photometric calibration.
 |
However, we will see in the paragraph according to whether for observations out of I with the CFH12K, it is essential to have the two types of images (built starting from the images of science and the images of the twilight).
Figure 7.8 shows a rough image, its chart of quantum effectiveness. We see that all the visible defects of the camera disappeared (except for the dead pixels).
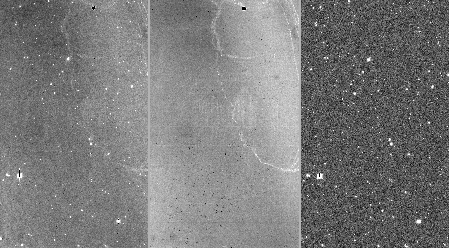 |