Figure 7.4
gives the shift towards the limiting red according to the time of
integration. To make this simulation, one considered a cosmology ``
standard '' ( ![]() )
and filters it I of the CFH12K. The supernova is supposed to be with
its maximum of luminosity. In this very favorable case, the CFH12K is
able to detect with a cut in signal on noise of 5 of the supernovæ to
the maximum until redshifts around 1.35 by considering
exposures of 3h for the image of reference and research. It makes it
possible to detect in a comfortable way (with a signal on noise around
10) of the supernovæ around 1.2 to the maximum, for conditions of
average observations. That can seem comfortable, but insofar as the
dates of the observations are forced enough, it is necessary to be able
to face bad conditions of observation.
)
and filters it I of the CFH12K. The supernova is supposed to be with
its maximum of luminosity. In this very favorable case, the CFH12K is
able to detect with a cut in signal on noise of 5 of the supernovæ to
the maximum until redshifts around 1.35 by considering
exposures of 3h for the image of reference and research. It makes it
possible to detect in a comfortable way (with a signal on noise around
10) of the supernovæ around 1.2 to the maximum, for conditions of
average observations. That can seem comfortable, but insofar as the
dates of the observations are forced enough, it is necessary to be able
to face bad conditions of observation.
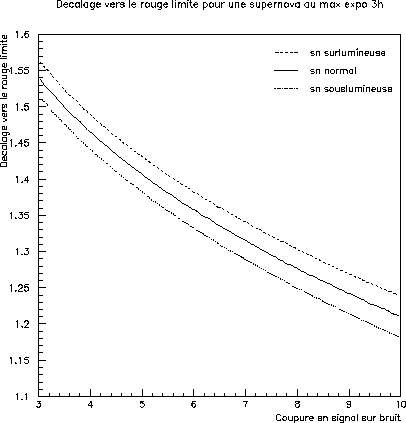 |
Figure 7.5 presents the shift towards the limiting red according to the duration. It is seen that the gain between 3h and 5h of exposure is tiny.
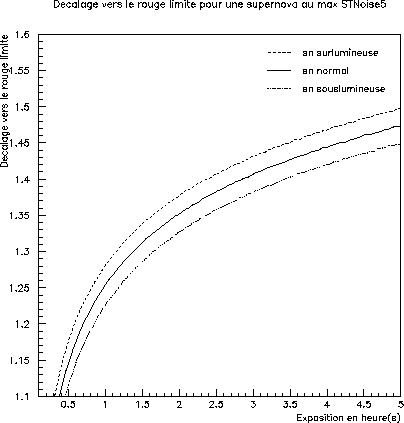 |
It was thus selected to carry out research with very great
redshift by comparing images of 3h taken in filter I
between 3 and 4 weeks of intervals. This duration corresponds to the
boarding time of a supernova to a redshift of 0.5, that is
to say ![]() days. What makes it possible in particular to detect the supernovæ
before their maximum. Moreover, this duration makes it possible to
carry out the observations around new moons, periods during which the
light of the bottom of sky is the least significant.
days. What makes it possible in particular to detect the supernovæ
before their maximum. Moreover, this duration makes it possible to
carry out the observations around new moons, periods during which the
light of the bottom of sky is the least significant.
Times of integration are such as it is impossible that the observations are carried out in only one installation. The first reason is that the sky saturates the CCD with the CFH12K with less than 40 mn to new moon. One is usually given for rule which the sky should not exceed a third of saturation. Moreover, as we will see it in the continuation, the cameras present a certain number of cosmetic defects (of the died columns, hot pixels...) which it is essential to label and to eliminate during the image processing. Is thus carried out to shifted split installations of a few seconds of arc between each installation . The typical time of installation out of I is 10 minutes for the CFH12K.
Moreover, split integration makes it possible to eliminate the artifacts present on only one installation like the cosmic rays. For a 10 minutes installation the number of cosmic rays on a CCD is indeed of the order of the thousand in Mauna Kea. Of the same one can thus detect the movement of the possible asteroids, same slow, present in the field, to eliminate them.