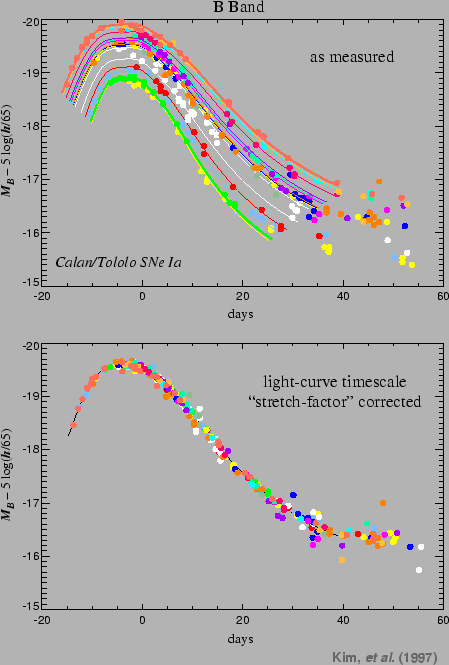
The correlation enters the shape of the lightcurve and the luminosity of the supernovæ of the Ia type was shown in 1993 by phillips1993. The study of a score of supernovæ close, discovered by Calà n-Tololo Supernovae Search (hamuy1993 & hamuy199ã) showed that the most luminous supernovæ were those whose lightcurve is broadest 6.1 illustrates this correlation. It shows the lightcurves of the supernovæ of Calà n Tololo brought back in a reference frame to 10 parsecs of the observer. We note indeed that the narrowest curves correspond to the least luminous supernovæ.
This
characteristic is currently measured mainly in two manners. The first
is the measurement of the rate of decrease of luminosity between the
maximum and 15 days after this maximum: ![]() (phillips1993).
(phillips1993).
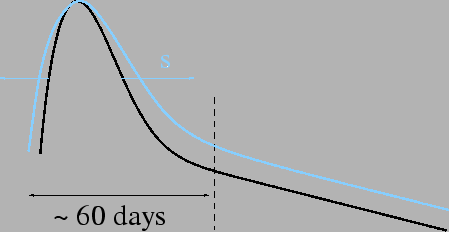
The second is the measurement of factor of temporal stretching of the lightcurve or factor of `` stretch '' (goldhaber2001) necessary to bring the lightcurve observed to the shape of the owner of curve of light defined by goldhaber2001. This owner thus has, by definition, a factor of stretching equal to 1.
If one has an owner of lightcurve ![]() is written:
is written:
| (6.1) |
Figure 6.2 illustrates the use of the factor of stretching which makes it possible the curve of black light to be brought to the shape of the blue curve.
goldhaber2001 showed that this parameterization made it possible to adjust the lightcurves of the supernovæ observed by SCP and hamuy1996c in the phases ranging between -20 and +35 days around the maximum of luminosity for the filter B.
Finally, the corrections using two measurements (factor of stretching and ![]() ) make it possible to reduce the dispersion of luminosity to the maximum in the filters B and V around 15%.
) make it possible to reduce the dispersion of luminosity to the maximum in the filters B and V around 15%.
In the continuation, we will use the measurement of the factor of stretching for the analysis of our lightcurves. This technique with the advantage of giving a simple parameterization of the curves of light.
 |